
Streamlit是一个开源库,致力于以更高效、更灵活的方式可视化数据,并分析结果,帮助数据科学家在短时间内开发机器学习 (ML) 可视化仪表板。只需几行代码,我们就可以构建并部署强大的数据应用程序。
为什么选择Streamlit?
目前,应用程序需求量巨大,开发人员需要一直开发新的库和框架,帮助构建并部署快速上手的仪表板。Streamlit 是一个库,可将仪表板的开发时间从几天缩短至几小时。以下是选择 Streamlit 的原因:
- 1. Streamlit是一个免费的开源库。
- 2. 和安装其他python 包一样, Streamlit的安装非常简单。
- 3. Streamlit学起来很容易,无需要任何 Web 开发经验,只需对 Python 有基本的了解,就足以构建数据应用程序。
- 4. Streamlit与大部分机器学习框架兼容,包括 Tensorflow 和 Pytorch、Scikit-learn 和可视化库,如 Seaborn、Altair、Plotly 等。
所需的应用程序和软件包:
Streamlit需要以下应用程序和包。
- 1. Python — 至少是 Python 3.7 或更高版本。
- 2. pip — 我们可以在终端或使用代码编辑器安装 pip。
- 3. Streamlit — 在启动 Streamlit 应用程序之前,我们必须安装 Streamlit 库。在终端中执行以下命令,安装streamlit。
pip install streamlit让我们用 streamlit 创建一个基本的应用程序。
- 1. 要创建基本的 streamlit 应用程序,你需要创建一个新的 Python 文件,文件名任意,例如 app.py,然后保存。
- 2. 然后使用安装的 IDE 或文本编辑器打开新创建的文件。
- 3. 在新的 python 文件中使用以下代码。
# Importing streamlit
import streamlit as st
# Add title and Write in
st.title('This is our First application with streamlit')
st.write("Streamlit is an awesome new tool that hepls to solve the problems quickly")- 4. 在终端中使用以下命令运行应用程序。
# this will help to run the streamlit application
streamlit run app.py- 5. 本地主机超链接将出现在终端中。在浏览器中复制该链接,或单击该链接,获得输出结果,如下所示:
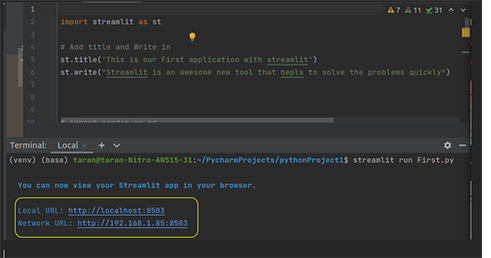
我们第一个应用程序的输出结果将在浏览器中显示如下:
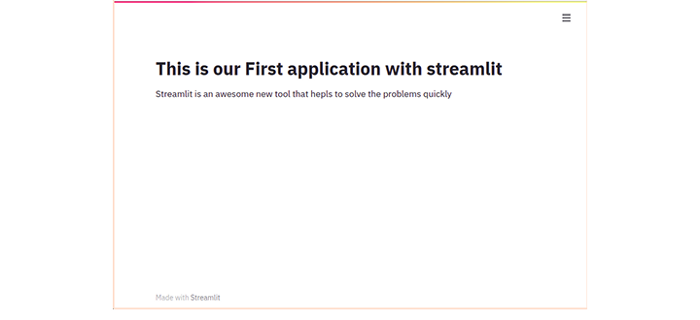
可视化(Visulaization)
要用 streamlit 进行可视化,我们需要一个数据集,在这里我们用的是一个和企鹅相关的数据集。数据集可以通过以下链接下载:https://www.kaggle.com/parulpandey/palmer-archipelago-antarctica-penguin-data?select=penguins_size.csv
首先在 python 文件中导入以下库:
import numpy as np
import pandas as pd
import matplotlib.pyplot as plt
import seaborn as sns
import plotly.express as px
import streamlit as st
from bokeh.plotting import figure
import altair as alt
下一步是导入数据集,并使用以下代码将结果写入输出屏幕:
df = pd.read_csv("Give the path of directory where you saved your csv file.")
#st.write will help to write data in application and head() will show the head of data.
st.write(df.head())
数据顶部将显示在输出屏幕上,如下所示:

让我们开始绘图吧。
使用 Streamlit 绘制折线图、条形图和面积图。
如果想要通过 Streamlit 绘制折线图、面积图和条形图,请使用以下代码。这些代码可以用来绘制企鹅的鳍长和喙长。
st.title('Line_Chart,Bar_chart,Area_chart')
df_dbh_grouped=pd.DataFrame(df.groupby(['flipper_length_mm']).count()['bill_length_mm'],)
df_dbh_grouped.columns=["flipper and bill length"]
# To draw line chart
st.subheader('Line_Chart')
st.line_chart(df_dbh_grouped)
# To draw bar chart
st.subheader('Bar_chart')
st.bar_chart(df_dbh_grouped)
# To draw area chart
st.subheader('Area_chart')
st.area_chart(df_dbh_grouped)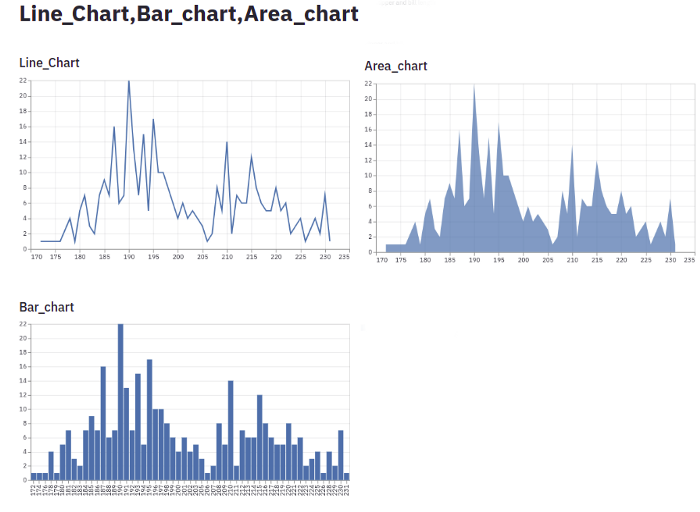
利用Seaborn和Matplotlib进行绘图
我们也可以使用matplotlib和seaborn库,通过stramlit绘图。下面的代码将用来绘制企鹅鳍长度的直方图:
import streamlit as st
import matplotlib.pyplot as plt
import seaborn as sns

st.title("Seaborn and Matplotlib Histograms")

# Making Saeborn Chat
st.subheader("Seaborn Chart")
fig_sb, ax_sb = plt.subplots()
ax_sb = sns.histplot(df['flipper_length_mm'])
plt.xlabel('Flipper_length_mm')
st.pyplot(fig_sb)

# Making Matplotlib chart
st.subheader('Matploblib Chart')
fig_mp, ax_mpl = plt.subplots()
ax_mp = plt.hist(df['flipper_length_mm'])
plt.xlabel('Flipper_length_mm')
plt.ylabel('Count')
st.pyplot(fig_mp)
输出结果:
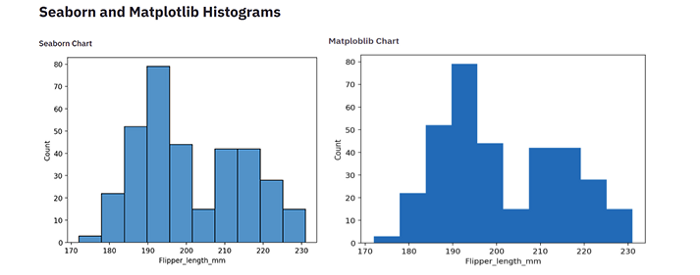
Plotly
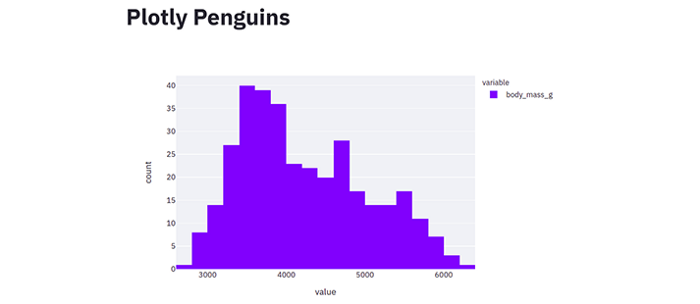
Plotly 是一个开源库,提供图表类型列表,和带有回调功能的工具制作仪表板。我们将使用 Plotly 可视化数据。导入 Plotly 库,然后使用以下代码绘制直方图:
#importnig plotly
import plotly.express as px
st.title('Plotly Penguins')
fig=px.histogram(df["body_mass_g"])
st.plotly_chart(fig)
输出结果:
Bokeh
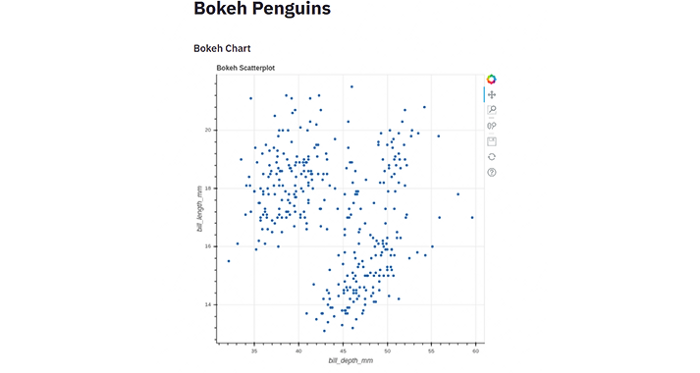
Bokeh 是一个 Python 数据可视化库,可生成快速交互式图表和绘图。我们使用Bokeh库创建散点图,代码如下:
import streamlit as st
from bokeh.plotting import figure
st.title('Bokeh Penguins')
st.subheader('Bokeh Chart')
scatterplot = figure(title = 'Bokeh Scatterplot')
scatterplot.scatter(df['bill_length_mm'], df['bill_depth_mm'])
scatterplot.yaxis.axis_label = "bill_length_mm"
scatterplot.xaxis.axis_label = "bill_depth_mm"
st.bokeh_chart(scatterplot)
输出结果:
Altair
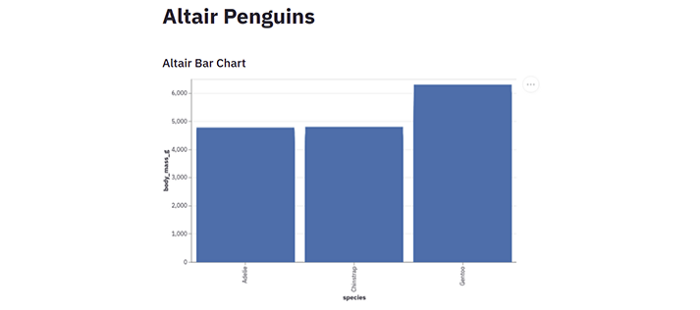
Altair 是一个 Vega-Lite Python 接口,帮助你在 Python 中指定 Vega-Lite 图表。 通过Altair 库,以下代码将帮助你绘制条形图:
import altair as alt
import streamlit as st
st.title('Altair Penguins')
st.subheader('Altair Bar Chart')
fig = alt.Chart(df).mark_bar().encode(x = 'species', y= 'body_mass_g').\
    properties(width=600,height=400)
st.altair_chart(fig)
输出结果:
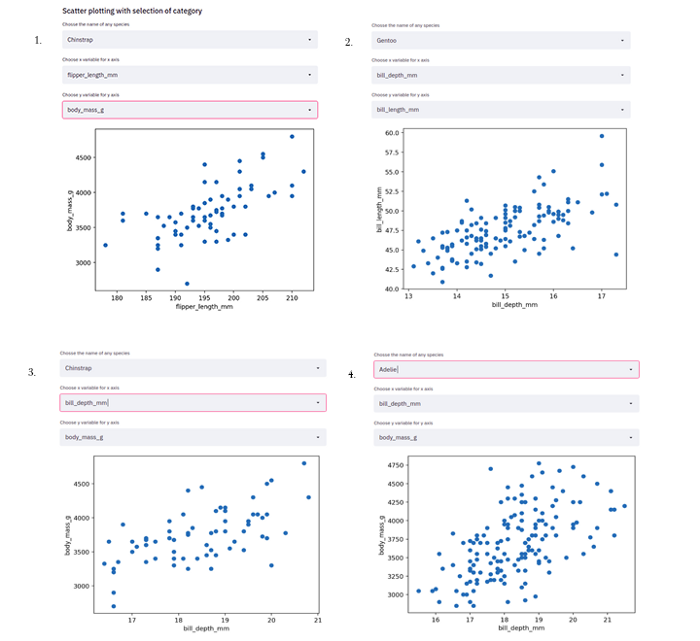
我们可以从企鹅数据集中选择不同类别的数据,绘制不同有趣的散点图。
以下代码将通过选择几个企鹅类别,并从喙长度、喙深度、鳍长和体重中选出 x 轴和 y 轴,绘制散点图。
st.subheader('Scatter plotting with selection of category')
# Select box  is a Display interactive widget
select_species = st.selectbox('Chosse the name of any species ',[ 'Gentoo', 'Chinstrap','Adelie'])
selected_x_variable = st.selectbox('Choose  x variable for x axis',['bill_length_mm', 'bill_depth_mm', 'flipper_length_mm',
'body_mass_g'])
selected_y_var = st.selectbox('Choose y variable for y axis',['bill_length_mm', 'bill_depth_mm', 'flipper_length_mm',
'body_mass_g'])
p_df = df[df['species'] == select_species]
fig, ax = plt.subplots()
ax=plt.scatter(x = p_df[selected_x_variable],
y = p_df[selected_y_var])
plt.xlabel(selected_x_variable)
plt.ylabel(selected_y_var)
st.pyplot(fig)
输出结果:

我们可以根据自己的喜好选择任意类别,绘制不同的散点图,如下所示。
结论
本文讲解了Streamlit的初始操作步骤。我们介绍了如何首次创建简单应用程序。在 Plotly、Bokeh 和 Altair 库的帮助下,我们可以对数据进行了某种可视化,帮助你创建其他数据应用程序。
恭喜你,你现在可以创建自己的 Streamlit 应用程序了。感谢你的阅读!
原文作者:Taranvir Singh
翻译作者:Lia
美工编辑:过儿
校对审稿:Jiawei Tong
原文链接:https://medium.com/crossml/streamlit-2256000541ad


